We are evaluating the graph formation by Arbitrum, the trends in the market, the trading volume, and potential future moves.
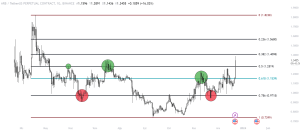
Arbitrum had a nice rise today. To evaluate the movement in the graph, it would make sense to use Fibonacci levels and determine significant support-resistance points.
First of all, let’s draw Fibonacci levels to see the significant resistance levels of ARB. In the chart, we can see that ARB has broken a significant resistance level and a daily close above this level could have a positive impact.
Our significant resistance level was $1.28, equivalent to the Fibonacci 0.5 level. The current price of $1.40 is equivalent to the 0.382 Fibonacci level. If it also manages to break this level, there could be a potential that the path is open up to the $1.82 level and the rise can continue.

However, it may not be possible to see a direct rise. Minor corrections may occur, and these corrections could cause the price to retrace to the $1.28 band. At this point, if the price demonstrates horizontal movement at this level, it might be important for accumulating volume for a new rise and could create a positive scenario.
After corrections, horizontal movements, and volume accumulation, there is a chance ARB could continue its potential upward trend. However, due to the nature of the markets, there are always uncertainties, so it’s important to closely monitor the charts and follow the news.

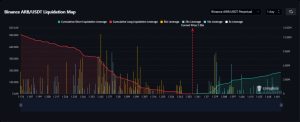
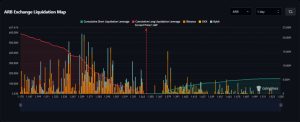
As we said earlier, there seems to be an expected correction on the ARB side, and we can see this from the liquidation map too. It is likely that ARB will experience minor corrections and retracements in the market to collect the liquidations it has left behind during this process.

Arbitrum Market Data
– Market value: 18.37%, 1.7 billion
– Volume (24 hours): 264.15%, $1.27 billion
– Volume/Market value (24 hours): %67.91
– Circulating supply: 1.27 billion ARB
– Total supply: 10 billion ARB
– Fully diluted market value: $13.37 billion
The Arbitrum Token can easily be bought and sold on Global Exchanges such as Binance, BitGet, Kucoin, Mexc, Houbi and Gate.io. Coin Engineer followers can use our reference code by clicking on the exchange you want to register from the discount link defined exclusively for them.


