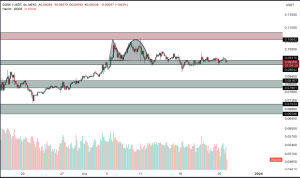
Doge price analysis will examine past price movements through charts and technical indicators. Identifying support and resistance levels will guide investors in making buying and selling decisions.
When analyzing the Doge chart, we observe a falling wedge formation that recently experienced an upward breakout from $0.072 levels to $0.10642 levels. However, in our previous blog post where we evaluated the (Inverse Head and Shoulders) formation, which occurred during Bitcoin’s uptrend, we expressed a consideration about whether this formation would occur or not.
Looking at the current chart, we observe that the price is exhibiting a clear horizontal movement in the expected breakout region of the inverse head and shoulders formation. This situation may suggest that the market is in a decision-making phase regarding a specific direction, and the price is in an accumulation period.
You might like: 2024 Cryptocurrency Move from Russia!
During this ongoing horizontal movement, it is important to consider factors such as liquidity conditions in the market, general developments in the cryptocurrency market, and Dogecoin-specific news flow. Additionally, conducting volume analysis before the formation breaks out can be useful in anticipating signals of a potential trend change.

If a downward trend occurs in Bitcoin during this process, it is likely that Dogecoin may experience a breakdown towards the level of $0.09042. This scenario could be expected, considering the strong price relationship between Bitcoin and other cryptocurrencies. Subsequently, Dogecoin could undergo a downward movement towards sequential support levels.
However, if Bitcoin shows a potential rise to the $46,000 level, Dogecoin could receive a reaction from this level and gain upward momentum by forming the previously observed Adam and Eve formation. In this case, if the $0.10642 level is broken to the upside, it could signify the confirmation of the formation.
If the $0.10642 level is breached to the upside, the next target could be the $0.12525 level. However, there is uncertainty about whether these potential scenarios will materialize. Therefore, it is important for investors to closely monitor market movements, assess current developments, and keep their risk management strategies up to date.
Also, you can freely share your thoughts and comments about the topic in the comment section. Additionally, don’t forget to follow us on our Telegram, YouTube, and Twitter channels for the latest news and updates.


