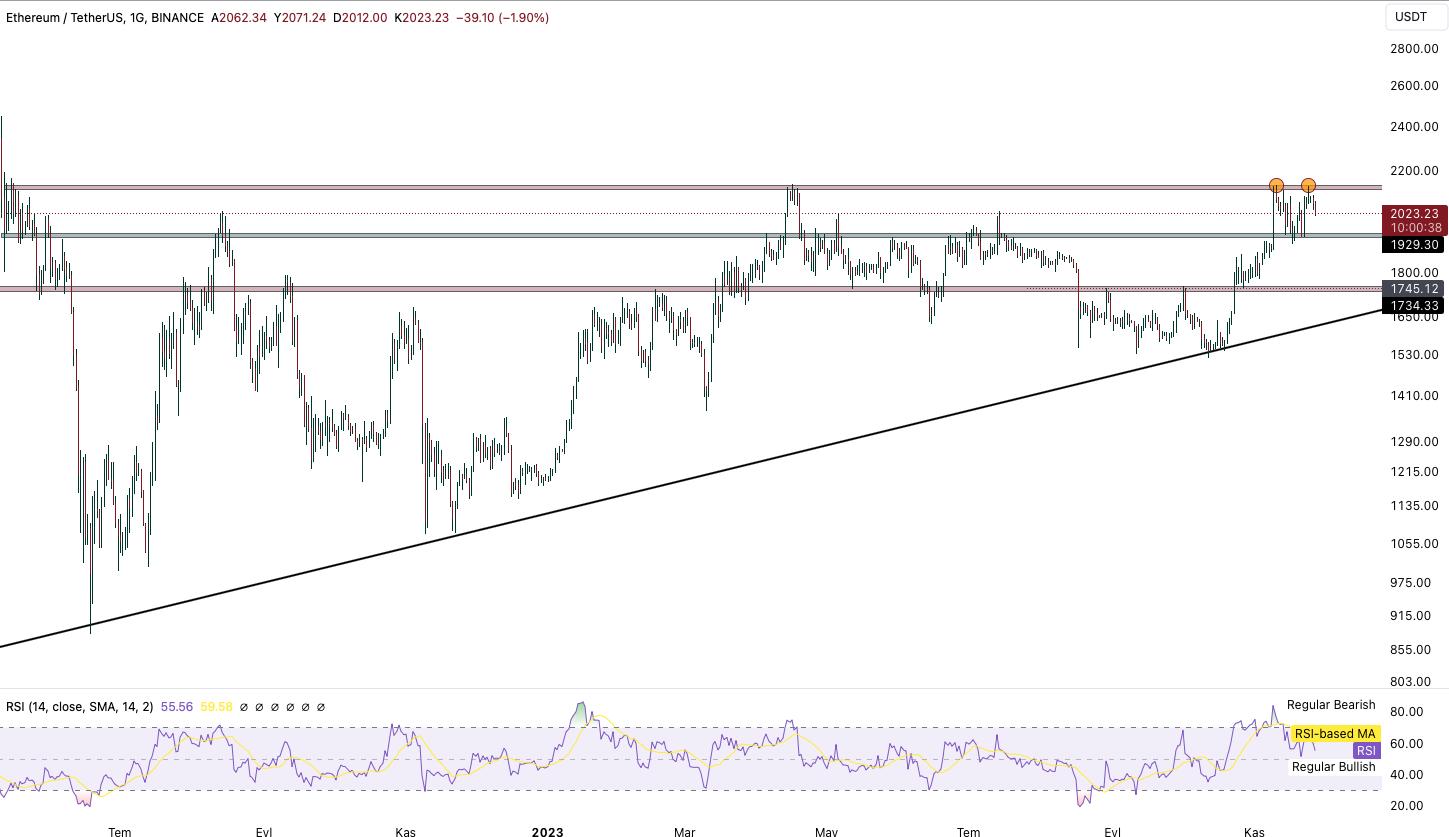
Ethereum ETH price analysis, we will analyze past price movements through charts and technical indicators. We will determine support and resistance levels and guide investors in their buying and selling decisions.
Approximately 18 days ago, we talked about which levels Ethereum will target above 2070 dollars and the potential start of a downtrend under 2070 dollars. Now we will assess the changes that have occurred within these 18 days. We will discuss possible drops to what levels.
As a result, in the last 18 days, Ethereum (ETH) prices tested the 2070 dollar levels but struggled to surpass this level. Technical indicators point towards a possible downward trend, however, market conditions can change rapidly. Monitor the price chart on support levels closely and devise an investment strategy aligned with overall market dynamics. Stay updated with the market and refer to the article below for a precise assessment based on current data.
Double Top Formation in Ethereum

When we examine the Ethereum chart from a broad perspective, we observe an ascending trend ongoing for 527 days since June 18, 2022. However, the fact that Ethereum has recently struggled to find support above 2070 dollars indicates the formation of a double top formation in this zone.
This condition implies a possibility of a decline down to approximately 1945-1929 dollars. Without robust buyer pressure here, Ethereum might reach the double top formation target at $1745.


