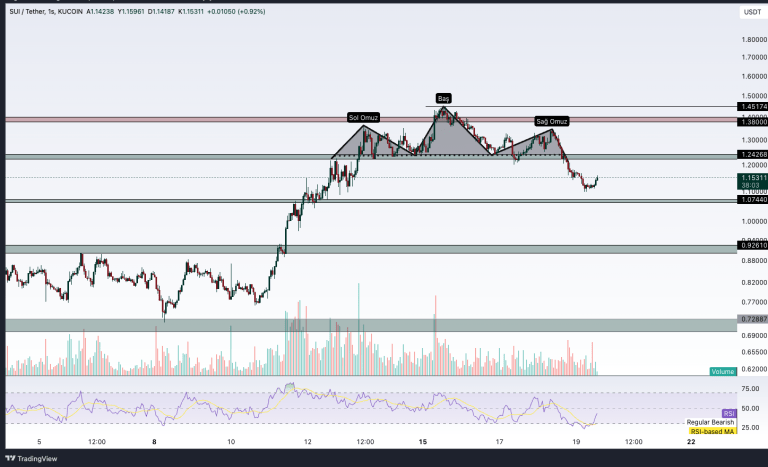
Sui Price Analysis! The price of Sui, which experienced sharp increases in recent days and exceeded the $1 price level, has fallen. So will the decline continue?
You might like: Bitcoin and Cryptocurrencies Status Update! – January 19
In this uptrend, the cryptocurrency formed a solid support zone above $1.24. Then, it rose to $1.38 for the first time from this region and then tested the support level of $1.24 again. After this test, there was an increase to $1.48. In this process, after testing the support level of $1.24 again, it rose to $1.38 again and formed a Head and Shoulders (HS) pattern.
Now, let’s examine this formation structure on the chart and evaluate the price movements at the relevant levels in detail.

After Sui formed the HS pattern, the formation was confirmed after losing the $1.24 level with the decline of Bitcoin. However, there was a pullback without touching the support point. The price may take a reaction from the $1.10 level and then make a retest movement to the HS formation. On the other hand, if Bitcoin does not start closing candles below the $40.735 support zone, Sui may experience another rise to $1.5 levels.
If Bitcoin starts closing candles below the support point, there is a possibility that Sui will be pulled back to the $1.07 support zone. With the loss of this region, there is a possibility of testing the strongest support point of $0.92 levels.


