Let’s Take a Look at the Weekly Chart for Bitcoin :
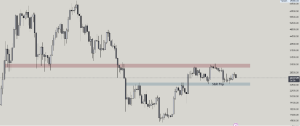
Bitcoin has been seeing strong purchases from the $26,552 level for the past two days. However, the risk of decline continues as the price cannot rise above $27,000. Looking at the weekly chart of Bitcoin, it has visited and managed to hold onto this region 3 times after the significant resistance level at $24,300 – $25,300, which was broken in the upward momentum that started in November 2022, was broken with volume.
The S/R Flip region, where the broken resistance turns into support, is our first important support area.
You might like: What’s Happening with Bitcoin and DXY?

The $30,300-$31,800 level, which worked as a support range in the past, was tried 2 times within 2023 but could not be broken and is working as a strong resistance area.
Let’s Take a Look at the 4-Hour Chart :
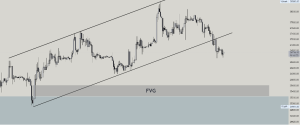
In the 4-hour chart, BTC, which continues its movement in the uptrend channel, started a decline movement that we think it broke this channel and will regress to the lower support in the past days. Additionally it is likely that the price will react from the FVG region left in the lower parts. It is beneficial to be careful in buy-oriented transactions up to these levels.

You can freely share your thoughts and comments about the topic in the comment section. Additionally, please don’t forget to follow us on our Telegram,YouTube and Twitter channels for the latest news.


