Ripple XRP chart formation, we evaluate market trends, trading volume, and possible future moves.
Additionally, we observe good structure formations on the XRP side, these formations indicate that good moves may come from XRP. Let’s start analyzing these structures now.
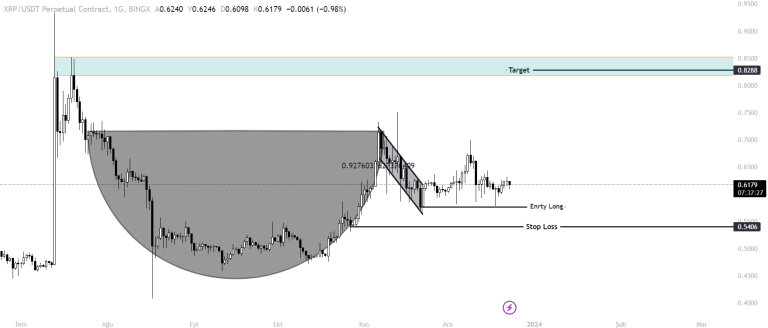
First of all, let’s consider the cup-handle formation. The formation is completed on the chart and has come to the entry point, from where it has reacted. If the formation moves as we expect, we can expect a rise up to $0.82. In a potential downturn, the $0.54 level can be useful for stop-loss.
XRP is a cryptocurrency developed by Ripple. Ripple is a payment protocol created to speed up interbank payments and to make financial transactions more efficient. XRP serves as a token used within the Ripple network for value transfer.
For More Information, You Can Read Our SHIB Coin Article!
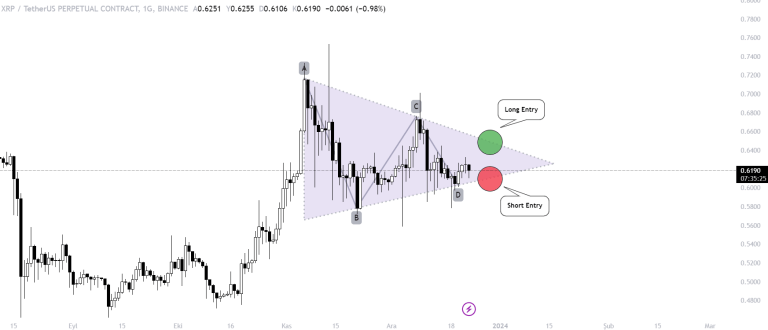
The formation is the symmetric triangle formed after the cup-handle structure. We can say that this triangle indicates a movement in the direction of the break. If this triangle breaks upwards according to our expectation, this could bring a nice rise for XRP and could mean the continuation of the cup-handle formation. The increase target expected by these two formations corresponds to the $0.85 level, which is a significant resistance level for XRP.
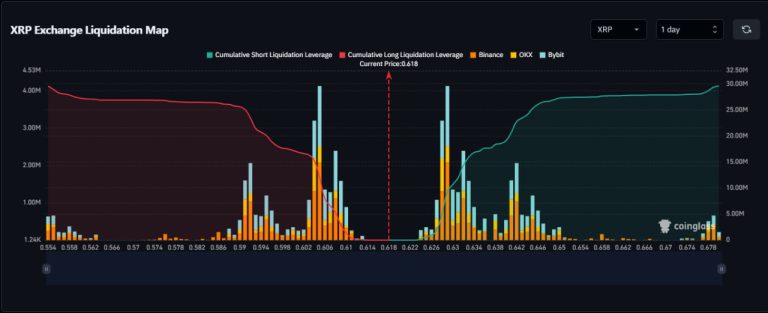
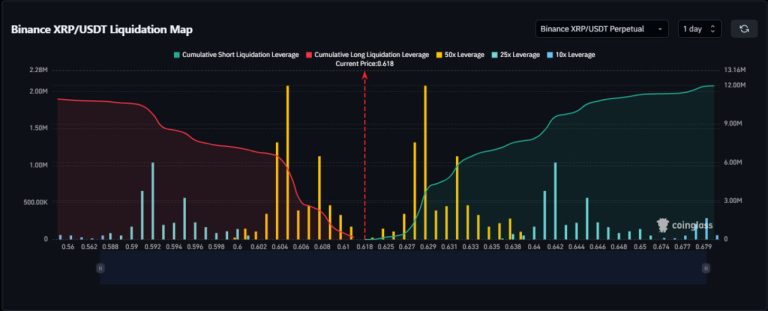
Ripple could see a high-leverage liquidation event ahead of a rally. As seen on the chart, Ripple could be heading towards liquidations due to the use of a certain amount of high leverage. After these liquidations, a bullish move could take place, which could signal a move up to close out previous short positions.
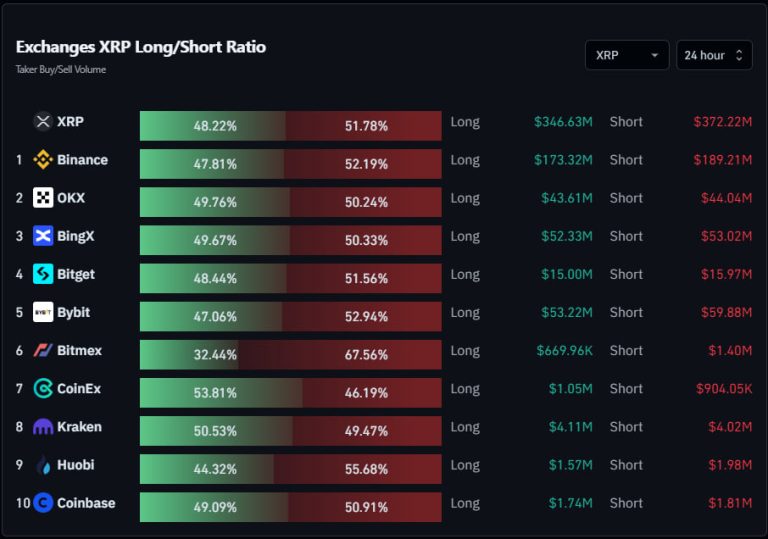
When we look at the long-short ratios on XRP, we see that short positions are more dominant. In this case, market makers can make a move in the opposite direction of the direction taken on the XRP side, which indicates a similar situation to the scenario we mentioned in the liquidation map.
- Market capitalization: $33.484.253.065, which is 0.02% of the total XRP supply
- Daily trading volume: $830.149.834
- Daily trading volume to market capitalization ratio: 2.55%
- Circulating supply: 54.065.019.376 XRP (54.07%)
- Total supply: 99.988.129.668 XRP
- Maximum supply: 100.000.000.000 XRP
- Fully diluted market capitalization: $61.933.304.476
Also, you can easily buy and sell Ripple (XRP) tokens on global exchanges such as Binance, BitGet, Kucoin, Mexc, Houbi, and Gate.io. If you want to benefit from the discount link specifically defined for Coin Engineer followers, you can use our referral code by clicking on the exchange you want to register.
Also, in the comment section, you can freely share your comments and opinions about the topic. Additionally, don’t forget to follow us on Telegram, YouTube, and Twitter for the latest news and updates.


