We observe a Butterfly Formation in the Synthetix (SNX) coin chart, and if this formation plays out, it could potentially signal the start of a bullish rally in SNX.
SNX, Synthetix Network Token, is the native token of the Synthetix protocol. Synthetix is a platform focused on creating decentralized financial products (DeFi). This platform enables users to create and trade synthetic versions of various assets. Users can invest in or trade tokens representing real assets that are synthetically generated on the blockchain.The SNX token supports operations on the Synthetix network and facilitates participation in the governance of the platform. Additionally, this token operates incentive reward mechanisms for the protocol. Synthetix allows users to be exposed to synthetic versions of stocks, commodities, cryptocurrencies, and other assets, enabling them to build a diversified portfolio.
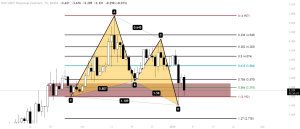
The formation works as follows: Firstly, an XA wave is formed, and we draw a Fibonacci from X to A. Following this upward movement, an AB correction occurs, and this correction movement aligns with the 0.786 point of the Fibonacci level we drew. Subsequently, another BC upward movement occurs, and this rise corresponds to the 0.382 point of our Fibonacci level. After that, the CD point is formed, which is not just a point but a potential reversal zone. These movements create a “butterfly” shape on the chart. If the formation is confirmed, meaning it surpasses specific levels, it could signify the beginning of a bullish rally in SNX.
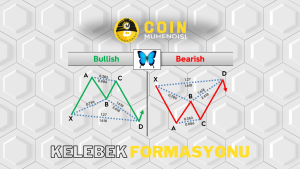
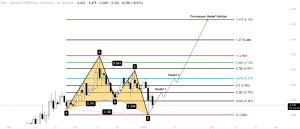
Now, we have three conditions for our D point. Firstly, the price should pull back to the 1.27 Fibonacci level, and the second one is the AB=CD formation. The third condition is no longer necessary since we’ve seen the second condition and are aware of the AB=CD formation. Now, let’s look at the target points if the formation is completed. To determine the target point, we need to draw a Fibonacci from point A to point D again, and this Fibonacci shows us the price ranges where our target points coincide.
You may notice: VanEck Gave Good News for Bitcoin Developers!
If the formation works, the first target will be the 0.382 Fibonacci level, and the next target will be the 0.618 Fibonacci level. Our formation target corresponds to the 1.618 Fibonacci level. However, until it reaches this point, profit realization can be done at higher Fibonacci levels.
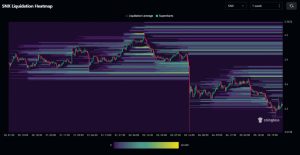
When we look at the liquidation heat map for Synthetix (SNX) , we observe that the liquidations below have been cleared, and all the liquidations are now above. This situation can potentially lead to a rapid upward movement in prices.
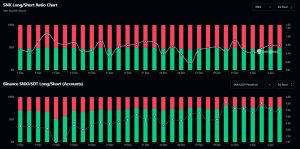
When we look at the open position ratios, we see that there is an overall excess of SHORT positions in SNX in the general market. However, on the largest exchange, Binance, we observe that LONG positions are more dominant. Here, a market upward movement may occur to liquidate the excess open short positions in the overall market.
SNX Market Data
Market Cap: $1,020,823,009 (#64 ranked)
Volume (24h): $68,440,435 (#109 ranked)
Volume / Market Cap (24h): 6.70%
Circulating Supply: 304,151,006 SNX
Total Supply: 328,193,104 SNX
Fully Diluted Market Cap: $1,102,352,424
SNX Token can be easily bought and sold on Global Exchanges such as Binance, BitGet, Kucoin, Mexc, Huobi, and Gate.io.


